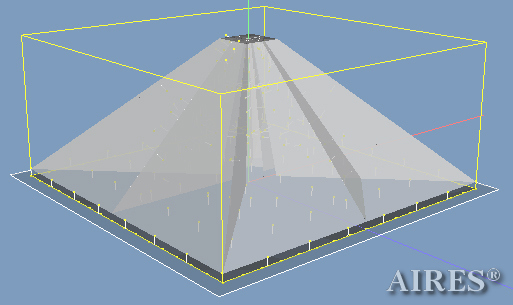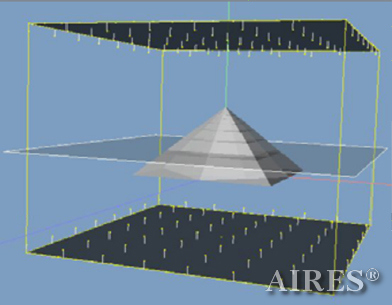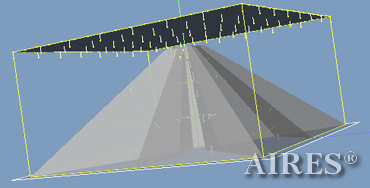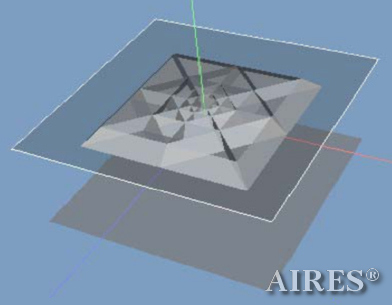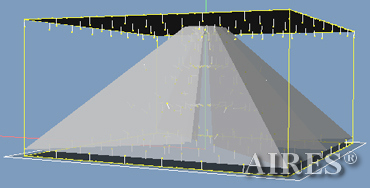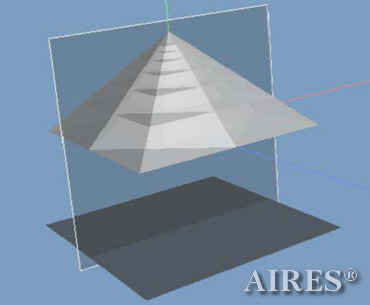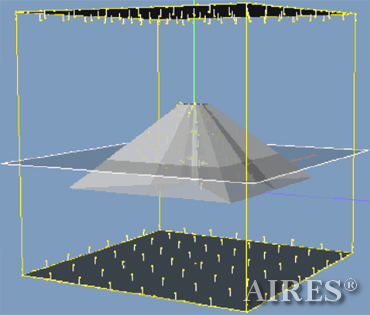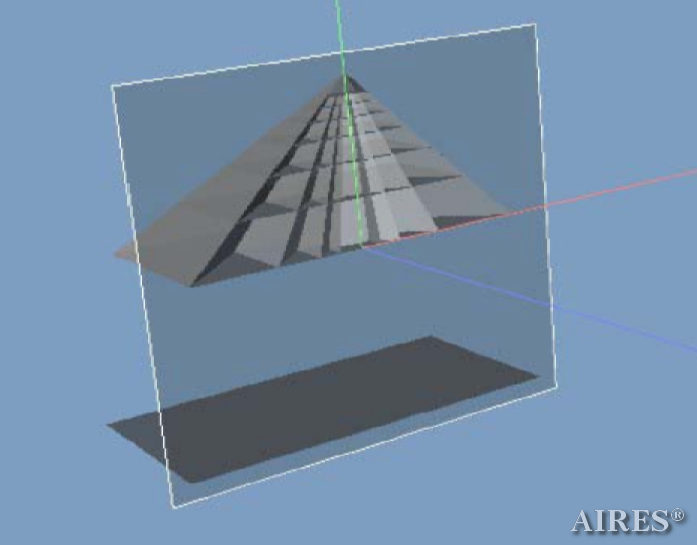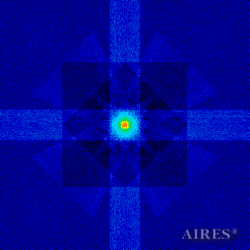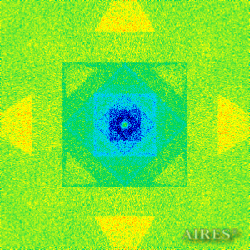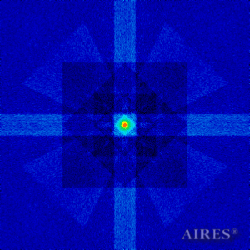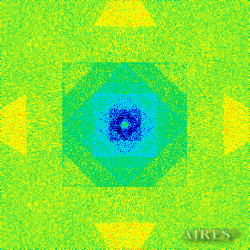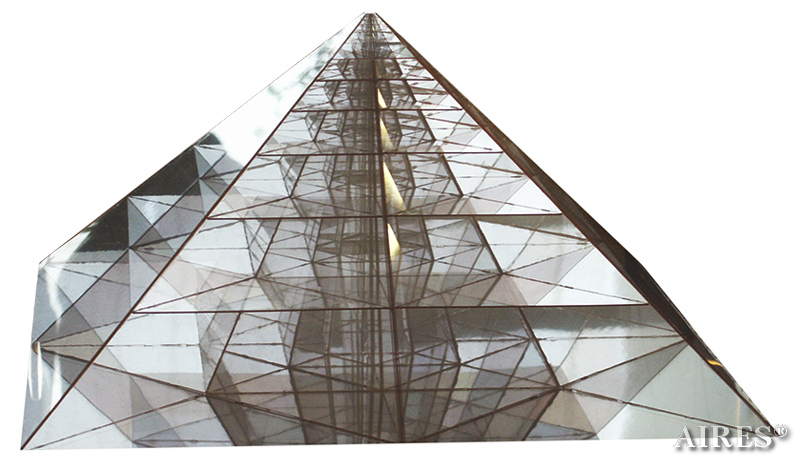
A specially modified VOB_LUMEX program was used to perform mathematical simulation of the interaction between electromagnetic radiation field and an Aires ecological converter model that had a geometrical structure based on the principles of universal stabilization of hypercomplex systems.
The converter models to be estimated were built in the Mechanical Desktop application. All faces are represented as infinitely thin planes, their reflecting and refracting properties are the same for every estimation variant. The interaction of the radiation flow with the models is calculated in ray approximation. Over forty variants were calculated for irradiating the models using homogeneous flat fronts under different irradiation conditions and optical model parameters.
Information on the topic
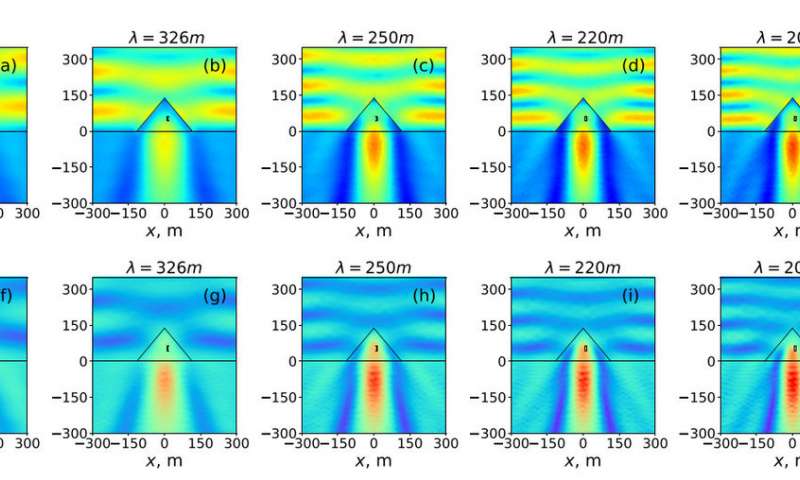
Study reveals the Great Pyramid of Giza can focus electromagnetic energy
An international research group applied methods of theoretical physics to investigate the electromagnetic response of the Great Pyramid to radio waves. Scientists predicted that under resonance conditions the pyramid can concentrate electromagnetic energy in its internal chambers and under the base. The research group plans to use these theoretical results to design nanoparticles capable of reproducing similar effects in the optical range. Such nanoparticles may be used, for example, to develop sensors and highly efficient solar cells. The study was published in the Journal of Applied Physics.
 |
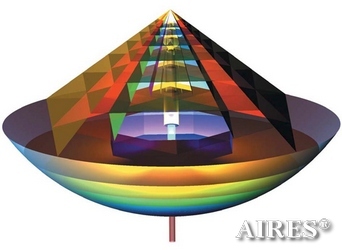 |
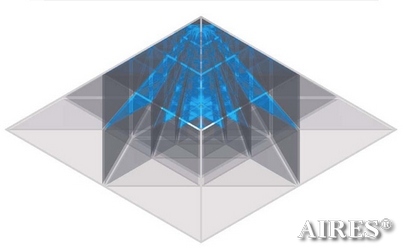
| Several graphic images of the designed construction | |
| Converter models with no apex with different direction variants of electromagnetic radiation falling on the converter | Converter models with an apex and planes of result analysis |
|
|
|
|
|
|
|
|
|
|
|
|
| Fig.1. Chart of models used in calculations. The sections show the inner structureof the converter: tier gradation and structure of flat sections. | |
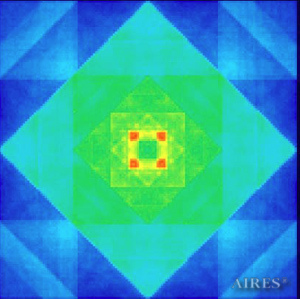
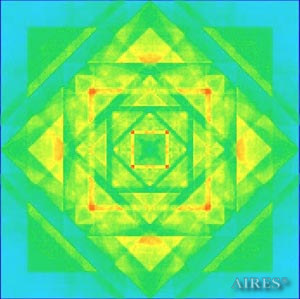
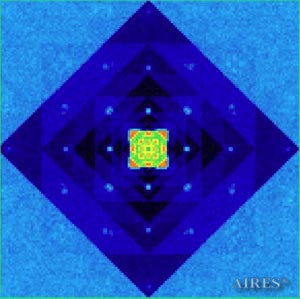
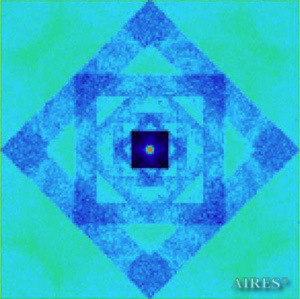
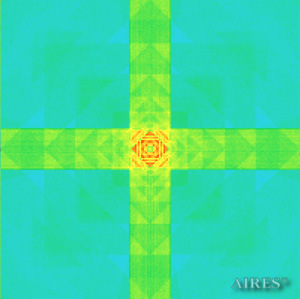
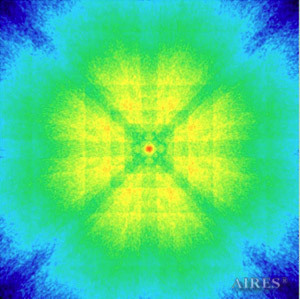
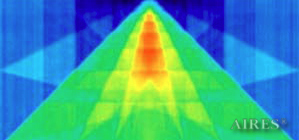
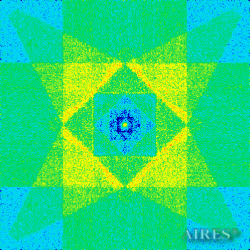
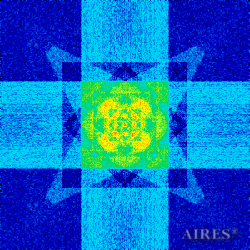
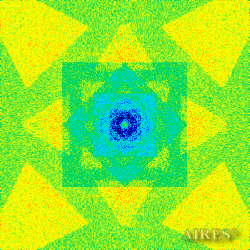
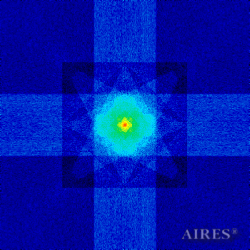
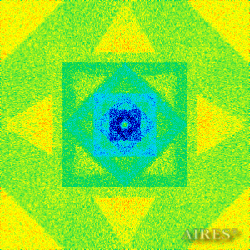
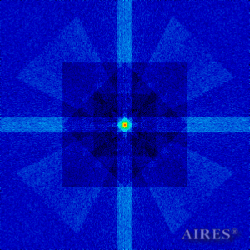
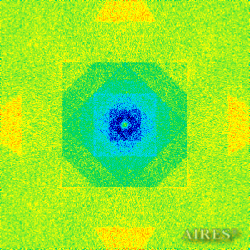
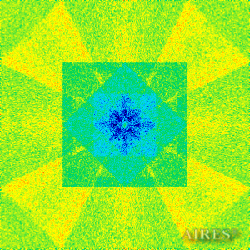
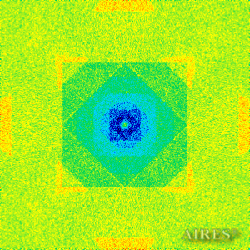
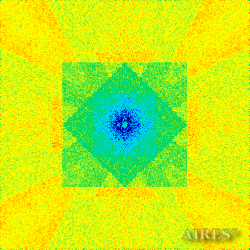
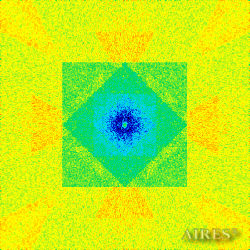
The above figures describe more indicative calculation results for the distribution of EM field intensity on the sections of the input models by planes parallel to the coordinates as shown in the table in Fig.1. The planes of analysis were at different heights from the converter base so as to reflect the intensity distribution in different areas inside and outside the converter. Colors in the Figure denote the intensity value. Red means the maximum, and purple means the minimum value in every analysis plane. The scale was selected on the basis of the best representation of the field structure.
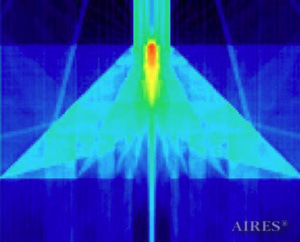
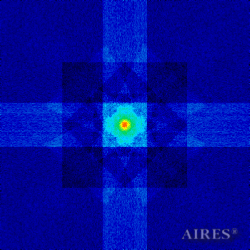
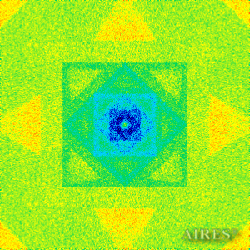
The obtained results lead to the conclusion that, when a flow of electromagnetic radiation interacts with the converter, the field gets an evident fractal character and stable spatial distribution of maximum and minimum intensity areas. The field structure is redistributed, and its multilevel coherent conversion takes place inside and outside the converter construction body (see Fig. 2 – 4a). A pronounced increase in the field intensity occurs in the upper tier area of the converter, as shown in Fig. 5-8. That concentration area has tier gradation corresponding to the internal structure of the converter.
Comparison of EM field distribution in the horizontal plane at a distance of 1/3 of the Aires converter height above its top, shown in Fig. 4, with the distribution of the EM field of the biologically active complex (Fig. 4) leads to the conclusion about structural correspondence of those distributions, determining the possibility of resonance interaction.
Distribution of electromagnetic field intensity in the horizontal section
|
|
|
| Fig.2. Distribution of electromagnetic field intensity (linear scale) in the horizontal section with irradiation from below:а) between the converter base and the first tier. The smallest light square is a section of the inner pyramid itself, however, inside the square there is a pronounced structure of intensity maximums and minimums. The distribution also appears regular within all intervals between the construction elements;b) between the second and the third converter tiers. The bright light square in the center of the Figure is a section of the inner pyramid. Inside and around it there is a regular system of local intensity maximums. There is a fractal copy of the bases of the large pyramids outside the construction section. | |
|
|
|
| Fig.3. Distribution of electromagnetic field intensity (logarithmic scale) in the horizontal section with irradiation from above and from below:а) above the converter top at a distance Н from the top. Beside the fractal copy of the construction, the Figure reveals the stable system of regular point maximums of intensity, forming a rational net;b) under the converter base, at a distance of 2/3 Н downwards from the base. The Figure demonstrates the formation of the fractal construction copy in the intensity distribution outside its volume. | |
|
|
|
| Fig.4. Distribution of electromagnetic field intensity (logarithmic scale) in the horizontal section:а) in the area of the fifth converter tier (near the top) with irradiation from above. It is interesting to note the formation of the cross-shaped ray structure and the multiple flat copy of the section construction outside it;b) at a distance of 1/3Н above the converter top with irradiation by a point source placed in the center of the base. Apart from the fractal copy of the construction, the Figure reveals the regular distribution picture of field intensity maximums and minimums, as well as the pronounced ray structure. | |
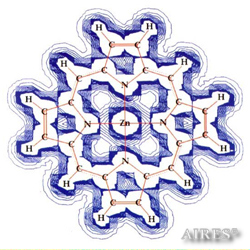
Рис. 4-2. Модель распределения электромагнитного поля биологически активного комплекса.
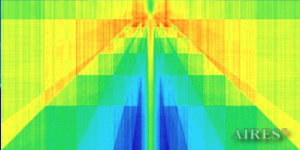
Distribution of electromagnetic field intensity in the vertical section (logarithmic scale), passing through the converter axis.
|
|
|
|
|
|
Some variants of model calculation for the interaction of the designed construction with electromagnetic field.
Mathematical simulation was carried out for the interaction between Aires ecological converter (pyramidal converter), having a geometrical structure based on the construction principles of stable hypercomplex systems and an electromagnetic radiation field, and the structure of the converted field of radiation was revealed.
The appendix gives the calculation results of several radiation variants for different modifications of the converter construction.
Variant 1. Irradiation from the bottom by a flow, going vertically upwards, and by a flow, going from the top vertically downwards, with a contrast ratio of 0.1 and an admission ratio of 0.9, the converter with the top, enlarged calculation area.
General view of the model
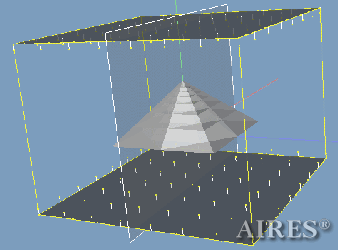
To analyze the structure of the field intensity distribution in the converter, the present account of the calculation results uses density in relative values. For every section, red means the maximum density in this section, and blue, accordingly, the minimum density. For color-coding the results, the logarithmic scale is used.
With a converter height of 22000 and a base length of 44000, the calculation area is assumed a parallelepiped with sides of 60000*60000*66000, so that the field density distribution below, above and around the converter is calculated. The bottom of the converter coincides with the plane U=0, the upper tier– with the plane U=19250, the vertical axis passes through the center of the calculation area.
The enlarged calculation area is selected under the condition that the vertical direction can be used to obtain density distribution of the field radiation outside the converter in the areas that are virtual analogs of the construction, symmetrical to the construction relative to the bottom plane and the plane, passing through the converter top.
|
|
|
|
|
|
|
|
|
|
|
|
|
|
|
|
|
|
|
|
|
|
|
|
|
|
|
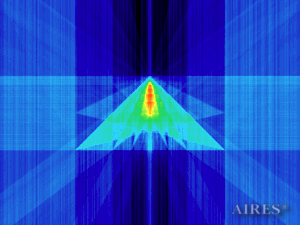 Vertical section through the converter axis (0) |
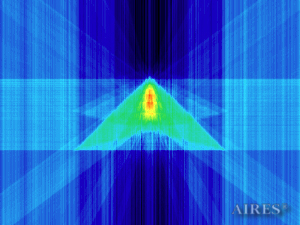 Vertical section (1000) |
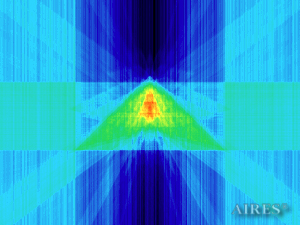 Vertical section (2000) |
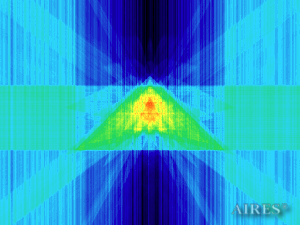 Vertical section (3000) |
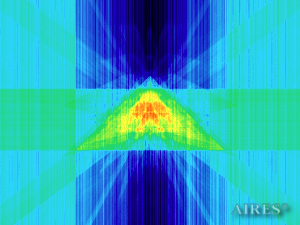 Vertical section (4000) |
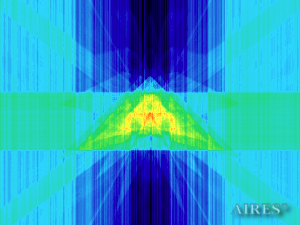 Vertical section (5000) |
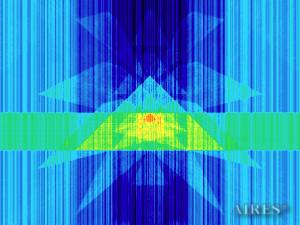 Vertical section (11000) |
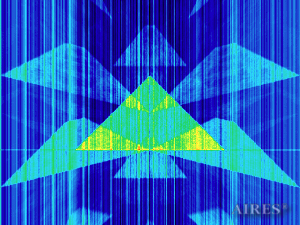 Vertical section (22000) |
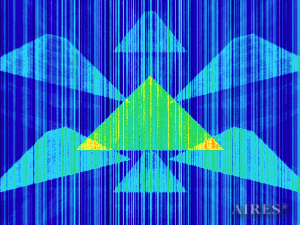 Vertical section (27500) |
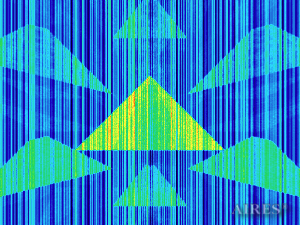 Vertical section (33000) |
Variant 2. Irradiation from the bottom by a flow, going vertically upwards, with a contrast ratio 0.5 and an admission ratio of 0.5 for the converter faces, and with a contrast ratio of 0.1 and an admission ratio of 0.9 for the socket construction elements, enlarged calculation area
General view of the system
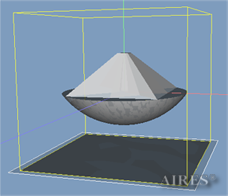
To analyze the structure of the field density distribution in the converter-socket system, the present account of the calculation results uses density in relative values. For each section, red means the maximum density in this section, and blue, accordingly – the minimum density. For color-coding the field density distribution, the logarithmic scale is used.
The socket depth is 16105, radius of the base sphere is 38105, the zero tier of the socket is situated in coordinate 0, vertically; the converter is placed on the socket, its base coincides with the zero tier of the socket, the converter height is 19250. The calculation area is assumed a parallelepiped with sides of 66000*66000*80000. The vertical axis goes through the center of the calculation area. The field density distribution inside and outside the system is shown.
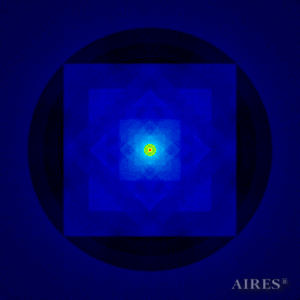 Horizontal section 0 (the converter bottom and the socket top) |
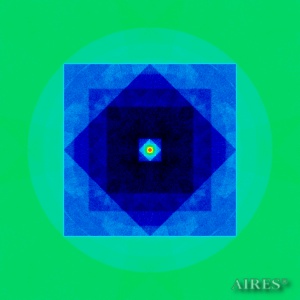 Tier 1 (6444) |
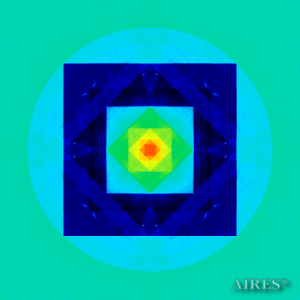 Tier 2 (11000) |
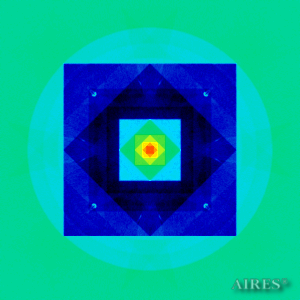 Tier 3 (14222) |
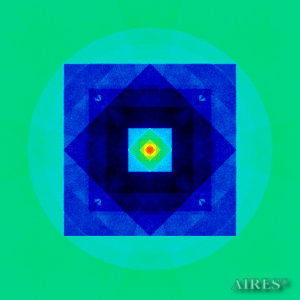 Tier 4 (16500) |
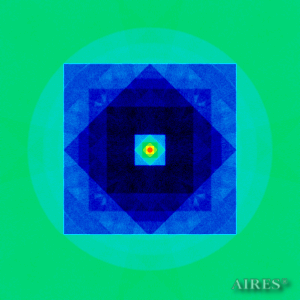 Tier 5 (18111) |
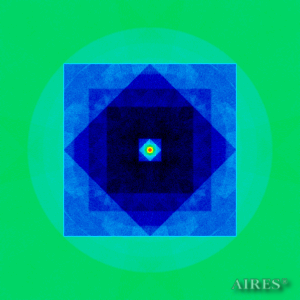 Tier 6 (19250) |
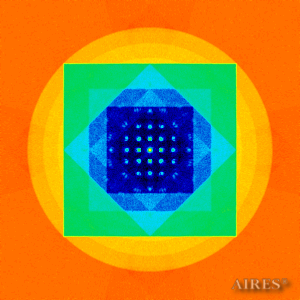 Plane above the converter (22000) |
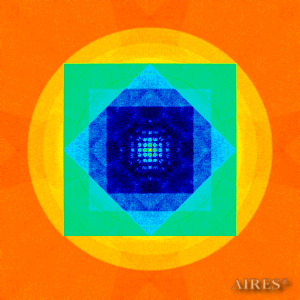 Plane above the converter (24000) |
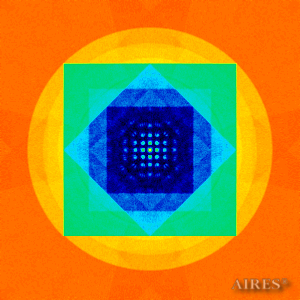 Plane above the converter (26000) |
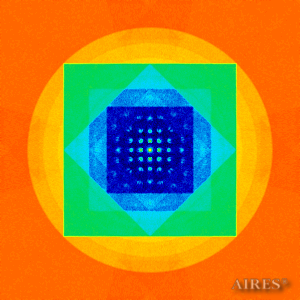 Plane above the converter (28000) |
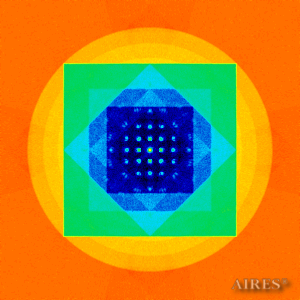 Plane above the converter (30000) |
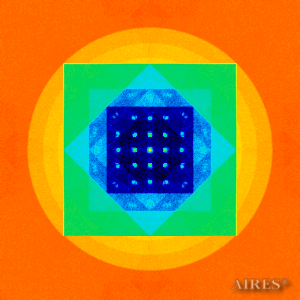 Plane above the converter (34000) |
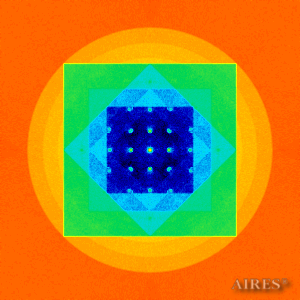 Plane above the converter (38000) |
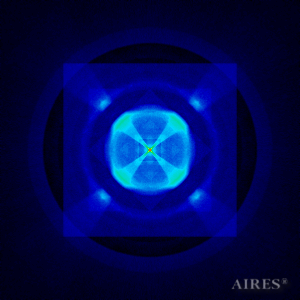 Horizontal section in the socket (-4717) |
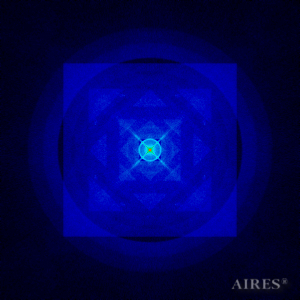 Horizontal section in the socket (-8058) |
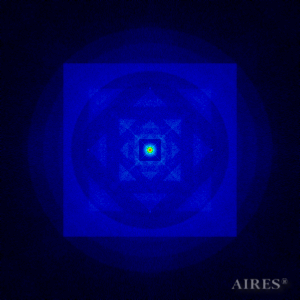 Horizontal section in the socket (-10411) |
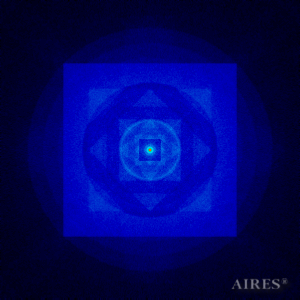 Horizontal section in the socket (-12079) |
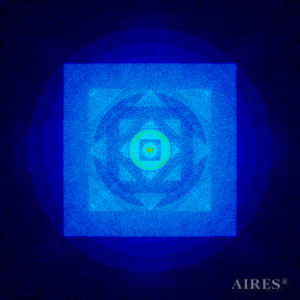 Horizontal section in the socket (-13258) |
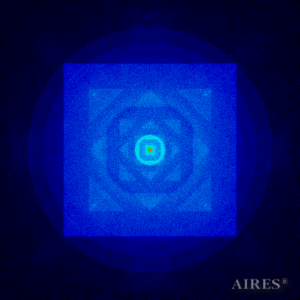 Horizontal section in the socket (-14092) |
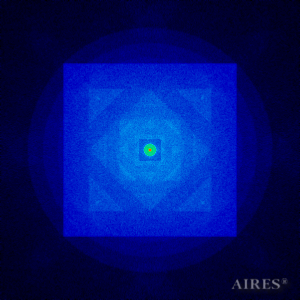 Horizontal section below the system (-16105) |
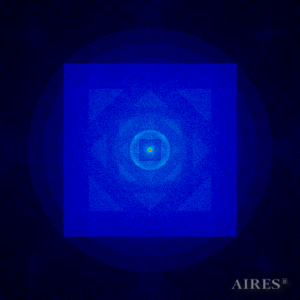 Horizontal section below the system (-18000) |
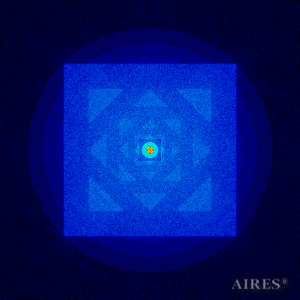 Horizontal section below the system (-22000) |
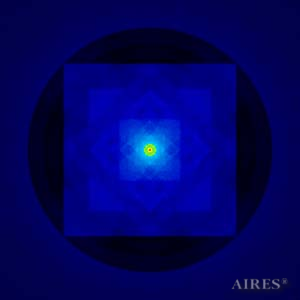 Horizontal section below the system (-27500) |
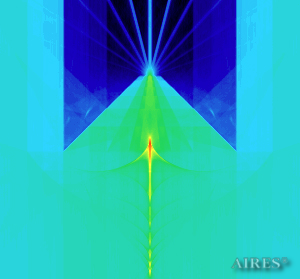 Vertical section through the system axis (0) |
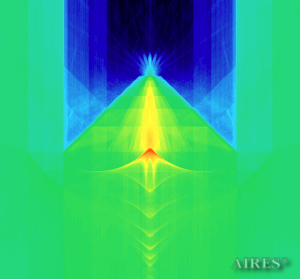 Vertical section (1000) |
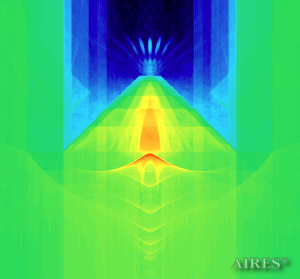 Vertical section (2000) |
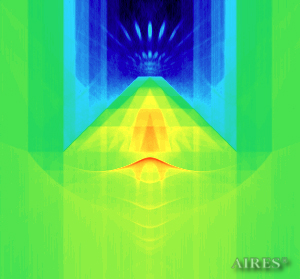 Vertical section (3000) |
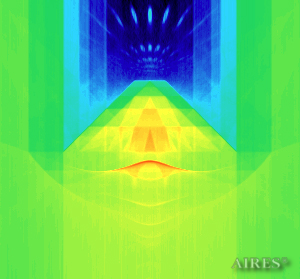 Vertical section (4000) |
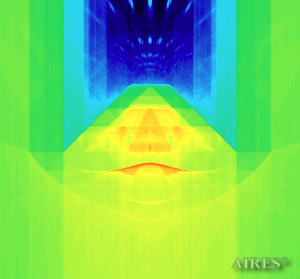 Vertical section (5000) |
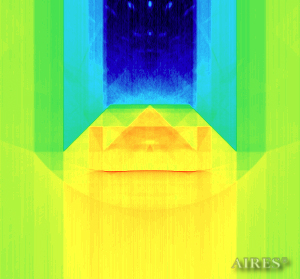 Vertical section (10000) |
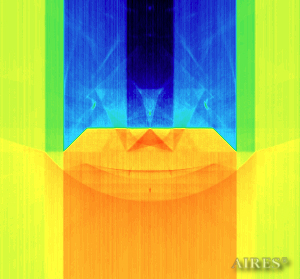 Vertical section (16000) |
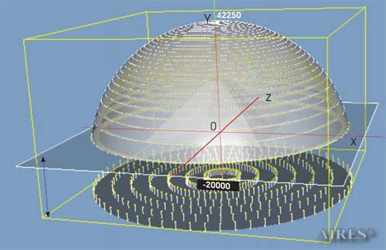
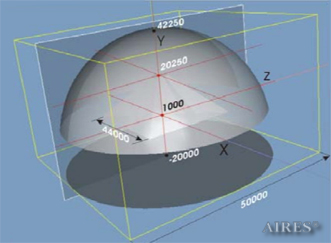
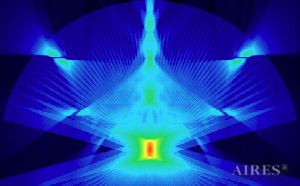
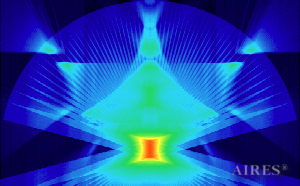
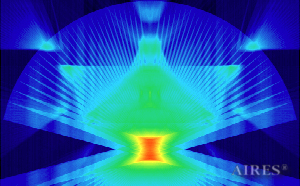
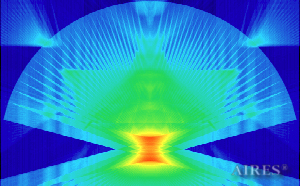
Variant 3. Irradiation from the bottom by a flow, going vertically upwards, and a by flow, going normally from every point of the hemisphere, with a contrast ration of 0.1 and an admission ration of 0.9, enlarged calculation area.
General view of the model
 |
 |
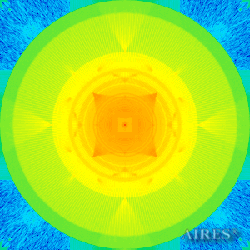
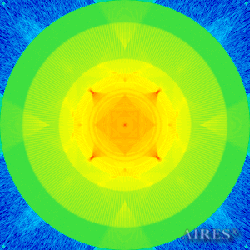
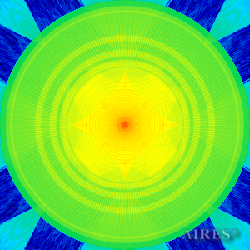
To analyze the structure of the field intensity distribution in the converter, the present account of the calculation results uses density in relative values. For every section, red means the maximum density in this section, and blue, accordingly, the minimum density. For color-coding the results, the logarithmic scale is used.
The converter height is 19250, its base side length is 44000, the calculation area is assumed a parallelepiped with sides of 100000*100000*62250. The selected radius of the spherical surface is = -50000, its apex is placed in point Y=42250. The converter bottom coincides with plane У=1000, the upper – with plane У=20250, the vertical axis passes through the center of the calculation area. The field density distribution below, above and around the converter is calculated.
The horizontal sections are arranged in pairs, with the first section of the pair placed in the area of the corresponding converter tier and the other one (with a negative coordinate) placed symmetrically to the first one relative to the bottom plane (height 1000). Below is the horizontal section at half a distance from the sixth tier to the converter apex (height 21625). Consequently, symmetrical tiers of the virtual converter will be located at heights 23000, 24139, 25750, 28028, 31250, 35806, and its “bottom” – at height 42250.
 Tier 0 (1000 - дно) |
 Plane 0 |
 Tier 1 (7444) |
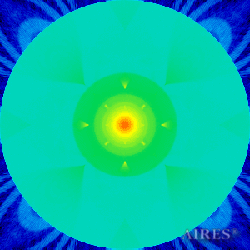 Plane -5444 |
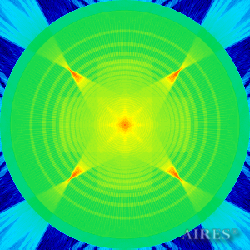 Tier 2 (12000) |
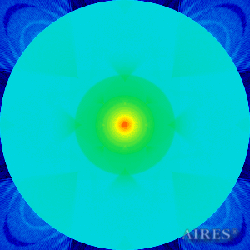 Plane -10000 |
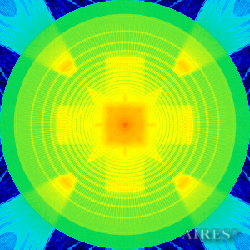 Tier 3 (15222) |
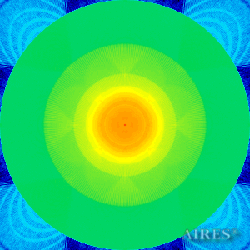 Plane -13222 |
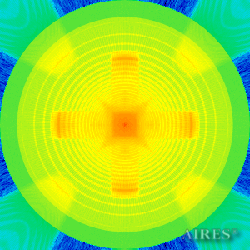 Tier 4 (17500) |
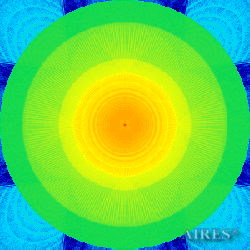 Plane -15500 |
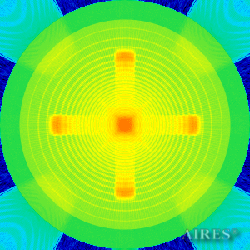 Tier 5 (19111) |
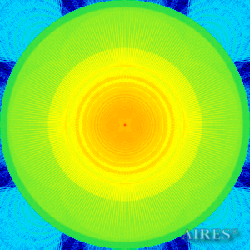 Plane –17111 |
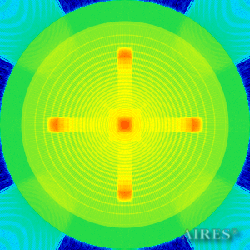 Tier 6 (20250) |
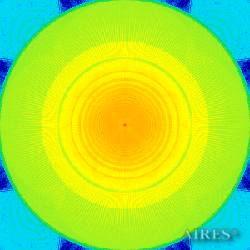 Plane -18250 |
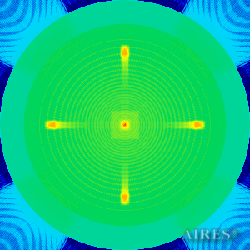 Plane 21625 |
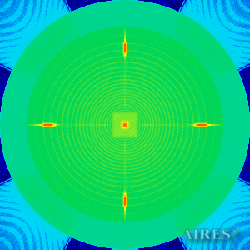 Plane 23000 |
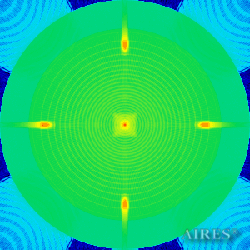 Plane 24139 |
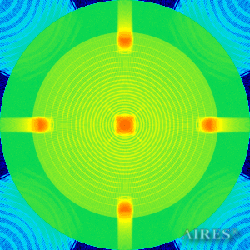 Plane 25750 |
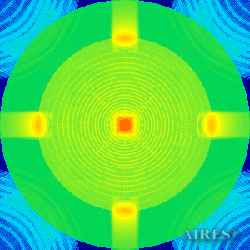 Plane 28028 |
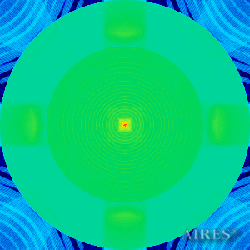 Plane 31250 |
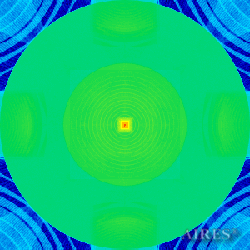 Plane 35806 |
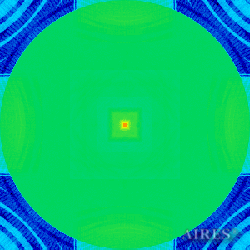 Plane 42250 |
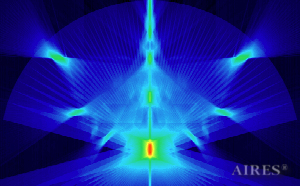 Vertical section through the axis |
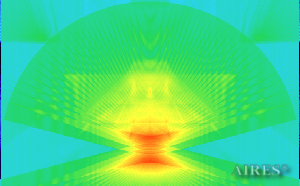 Vertical section 5 500 |
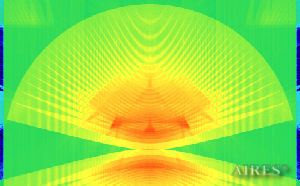 Vertical section 11 000 |
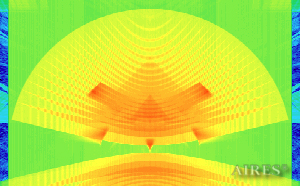 Vertical section 16 500 |
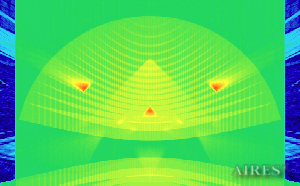 Vertical section 22 000 |
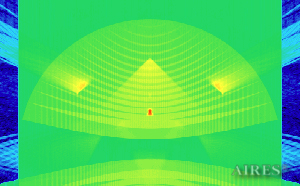 Vertical section 24 000 |
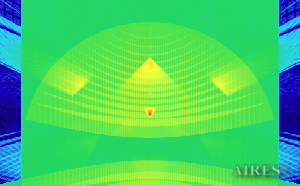 Vertical section 26 000 |
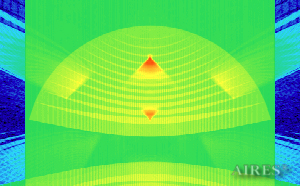 Vertical section 28 000 |
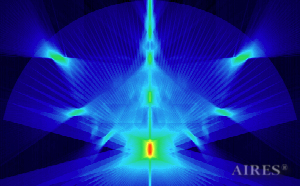 Vertical section through the axis |
 Vertical section 1000 |
 Vertical section 2000 |
 Vertical section 3000 |
 Vertical section 4000 |
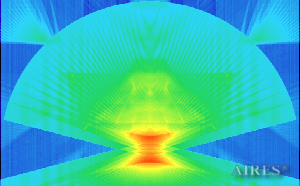 Vertical section 5000 |
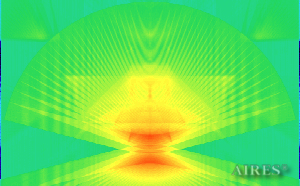 Vertical section 6000 |
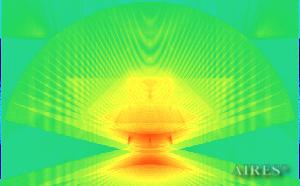 Vertical section 7000 |
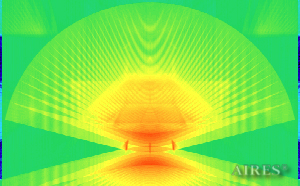 Vertical section 8000 |
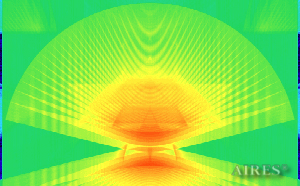 Vertical section 9000 |
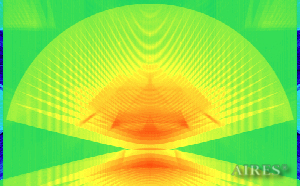 Vertical section 10000 |
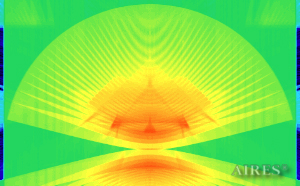 Vertical section 11000 |


